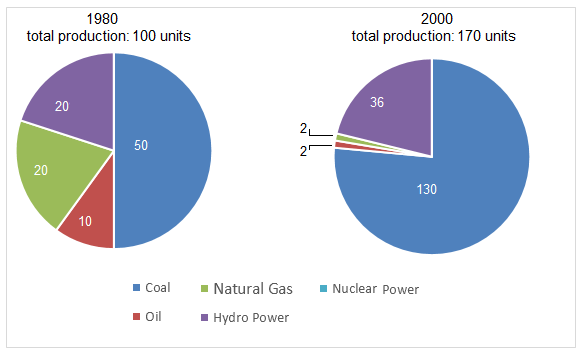
Question-The pie charts below show units of electricity production by fuel source in Australia and France in 1980 and 2000.Summarise the information by selecting and reporting the main features, and make comparisons where relevant.
Write at least 150 words.
Units of electricity by fuel source in Australia
Units of electricity by fuel source in France

The provided pie charts offer a visual representation of the transformation in electricity production by fuel source in Australia and France during the two decades spanning 1980 to 2000. A concise summary of the main features reveals notable shifts in energy production.
In 1980, Australia predominantly relied on coal for electricity generation, constituting a substantial 75% of the total output. Other sources, including oil, natural gas, and hydroelectric power, played comparatively minor roles. However, by the year 2000, there was a significant diversification in Australia’s energy mix. While coal remained the primary source, its dominance decreased to 50%, with natural gas witnessing a considerable surge to 20%. Additionally, the contribution of hydroelectric power increased, reflecting a more balanced energy portfolio.
Contrastingly, France exhibited a distinct energy profile. In 1980, nuclear power emerged as the predominant source, constituting over 60% of electricity production. The reliance on coal and oil was minimal. The year 2000 witnessed a noteworthy surge in nuclear power’s share, reaching approximately 75%, while the contributions from coal and oil dwindled significantly. This trend underscores France’s strategic shift towards nuclear energy for electricity generation.
In conclusion, the pie charts vividly depict the changing landscape of electricity production in Australia and France between 1980 and 2000. Australia diversified its energy sources, reducing its dependence on coal, while France consolidated its focus on nuclear power, highlighting distinct national strategies in response to evolving energy needs.


