

Question – The bar chart below shows the top ten countries for the production and consumption of electricity in 2014. Summarise the information by selecting and reporting the main features, and make comparisons where relevant. Write atleast 150 words.
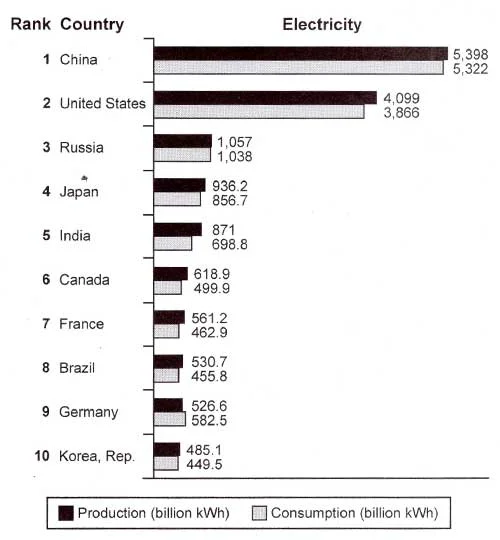
The bar graph outlines the electricity production and consumption figures for the top ten countries in 2014, highlighting China and the United States as the primary leaders in both categories. With all countries except Germany showcasing a surplus in generation over consumption, China emerged at the forefront, producing and consuming a staggering 5,398 and 5,322 billion kWh of electricity, respectively. Following closely, the United States ranked second in both production and consumption, registering 4,099 and 3,866 billion kWh, respectively.
Among the remaining eight nations, Russia stood out as the sole country with both production and consumption exceeding 1,000 billion kWh, reaching 1,057 and 1,038 billion kWh, respectively. Conversely, the Republic of Korea emerged as the smallest electricity-producing and consuming country, with figures of 485.1 and 449.5 billion kWh, respectively.
In the case of Japan, India, Canada, France, Brazil, and Germany, their electricity outputs ranged from 526 to 937 billion kWh, while their consumption figures varied from 455 to 857 billion kWh.
A noteworthy observation was that Germany was the sole country in this group to consume more electricity than it generated, recording figures of 582.5 and 526.6 billion kWh, respectively.