

Question – The chart below shows the percentage of households in owned and rented accommodation in England and Wales between 1918 and 2011.
Summarise the information by selecting and reporting the main features, and make comparisons where relevant. Write atleast 150 words.
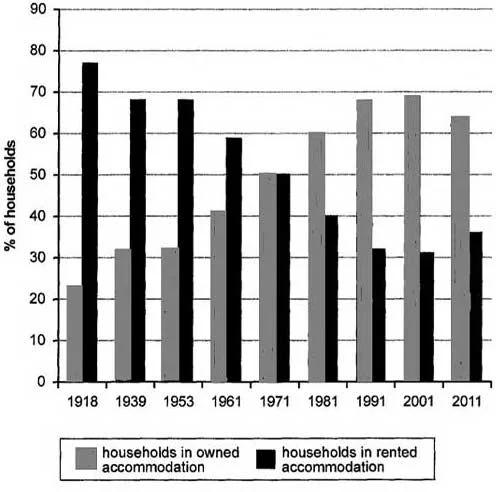
From 1918 to 2011, the bar graph delineates the shifts in the proportions of households owning and renting their residences in England and Wales.
Over the 93-year span, there was a discernible decline in the percentage of households opting to rent, while an upward trend was observed in those choosing ownership. Pre-1971, the prevalence of renting surpassed ownership, but post-1971, this pattern reversed.
In 1918, approximately 75 percent of households resided in rented accommodations. This figure experienced a significant plunge, reaching just over 30 percent in 2001, before a slight rebound to about 35 percent in 2011.
In contrast, only about a quarter of households were owner-occupied in 1918. This proportion began a steady ascent, aligning with the percentage of renter-occupied households in 1971, both at 50 percent. Ownership continued its upward trajectory, peaking in 2001 at just under 70 percent. Subsequently, there was a marginal decline to around 65 percent in 2011.