

Question – The chart below shows the total number of minutes (in billions) of telephone calls in the UK, divided into three categories, from 1995-2002.
Summarise the information by selecting and reporting the main features, and make comparisons where relevant.
Write at least 150 words.
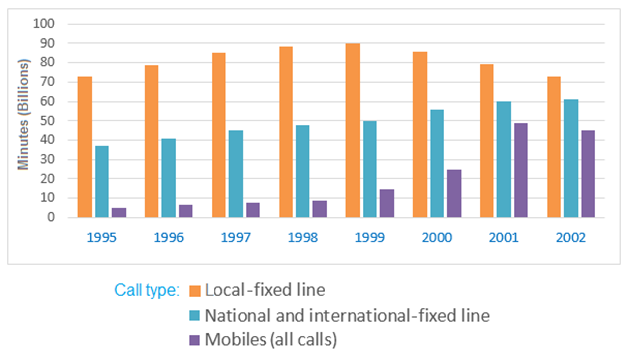
Examine the bar graph to observe the billions of minutes spent on phone conversations in Britain from 1995 to 2002. Local fixed-line calls dominated overall call types during this period, with a noticeable surge in cell phone usage in subsequent years.
After four years, local call duration steadily rose to approximately 90 billion minutes from the 1995 figure of 70 billion minutes. However, the span of local calls quickly decreased to a range between 70 and 80 billion. In stark contrast, national and international fixed-line and mobile calls collectively exhibited upward trends.
It is evident that the volume of fixed-line calls, both national and international, experienced a gradual increase from less than 40 to 60 billion in 2002. Meanwhile, mobile call volume showed a gradual increase in the first five years before rapidly surpassing 40 billion minutes.
Remarkably, over an eight-year period, local fixed-line calls remained the most prevalent of the three call types in the UK.