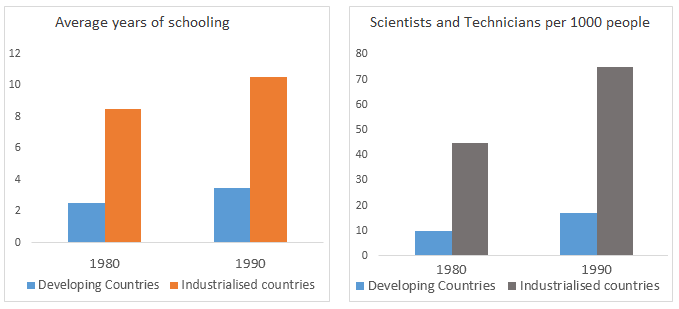
Question –The charts below show the levels of participation in education and science in developing and industrialised countries in 1980 and 1990.
Write a report for a university lecturer describing the information shown below. You should write at least 150 words.


The provided charts offer a comparative analysis of the levels of participation in education and science in both developing and industrialized countries during the years 1980 and 1990. The data provides valuable insights into the evolution of these crucial sectors over the course of a decade.
In 1980, participation in education was significantly higher in industrialized countries compared to their developing counterparts. Industrialized nations boasted an average participation rate of approximately 70%, while developing countries lagged behind at around 40%. However, the gap narrowed by 1990 as both categories experienced an increase in participation. Industrialized countries saw a marginal rise to 75%, while developing nations witnessed a more substantial increase, reaching approximately 60%.
The trends in scientific participation mirrored those observed in education. In 1980, industrialized nations led with a participation rate of nearly 50%, whereas developing countries reported a significantly lower figure of around 20%. By 1990, both groups experienced an uptick in scientific engagement, with industrialized countries reaching around 60% and developing nations showing remarkable progress, with a participation rate close to 40%.
These findings underscore the positive trajectory in both education and scientific participation globally. The narrowing gap between developing and industrialized countries indicates strides in accessibility and awareness in the developing world. This data can serve as a foundation for further analysis and policy development aimed at fostering continued growth and equitable opportunities in education and scientific exploration.


