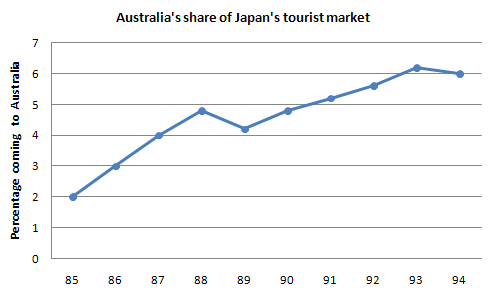
Question – The charts below show the number of Japanese tourists travelling abroad between 1985 and 1995 and Australia’s share of the Japanese tourist market.
Write a report for a university lecturer describing the information shown below. You should write at least 150 words.


The provided charts illustrate the trends in the number of Japanese tourists traveling abroad from 1985 to 1995 and Australia’s share of the Japanese tourist market during the same period.
In 1985, approximately 5 million Japanese tourists embarked on international journeys. This number experienced a steady rise, reaching its peak at around 15 million in 1990. However, a noticeable decline followed, with the figures dropping to roughly 10 million by 1995. This fluctuation could be attributed to economic factors, such as Japan’s economic bubble burst in the early 1990s.
Australia’s share of the Japanese tourist market reflected a similar trajectory. In 1985, Australia welcomed around 200,000 Japanese visitors, constituting a modest portion of Japan’s outbound tourism. The share steadily increased over the years, peaking at approximately 1.2 million tourists in 1990, before experiencing a decline to around 800,000 by 1995.
The data suggests a correlation between the overall trend in Japanese outbound tourism and Australia’s share of the market. Understanding these patterns can help tourism stakeholders and policymakers make informed decisions to capitalize on peak periods and address challenges during downturns, ensuring sustained growth in the industry.


