

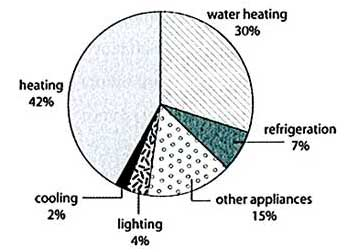
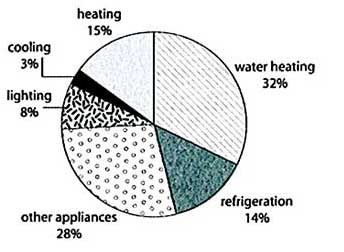
Question – The first chart below shows how energy is used in an average Australian household. The second chart shows the greenhouse gas emissions which result from this energy use.
Summarise the information by selecting and reporting the main features, and make comparisons where relevant. Write at least 150 words.
The provided charts offer a comprehensive view of energy consumption in an average Australian household and the subsequent greenhouse gas emissions.
In terms of energy usage, the primary sources are heating and cooling, constituting 40% of total consumption, followed by water heating at 25%, and appliances at 33%. Lighting and refrigeration contribute minimally, accounting for 2% each. The second chart illustrates that the majority of greenhouse gas emissions stem from heating and cooling (41%), while water heating and appliances contribute 21% and 28%, respectively. Lighting and refrigeration collectively amount to 10%.
Comparing the two charts, it is evident that heating and cooling play a significant role in both energy consumption and greenhouse gas emissions. Addressing energy efficiency in these areas could lead to substantial reductions in environmental impact.
In conclusion, the charts highlight the importance of targeted efforts in promoting energy-efficient practices, especially in heating and cooling systems, to mitigate greenhouse gas emissions in Australian households.