

Question –The graph and table below give information about water use worldwide and water consumption in two different countries. Summarise the information by selecting and reporting the main features, and make comparisons where relevant.You should write at least 150 words.
Water Consumption in Brazil and Congo in 2000
| Country | Population | Irrigated land | Water consumption per person |
| Brazil | 176 million | 26,500 km² | 359 m³ |
| Democratic Republic of Congo | 5.2 million | 100 km² | 8 m³ |
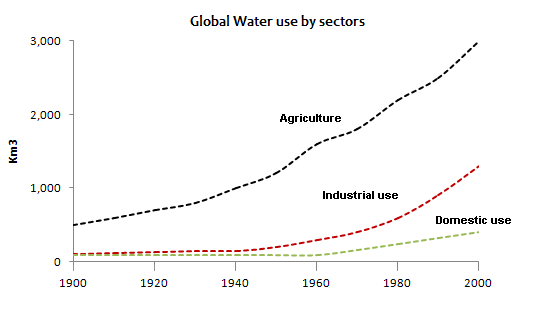
The provided graph and table offer insights into water usage patterns worldwide, with a specific focus on water consumption in two distinct countries. A concise summary reveals key trends and variations in water utilization.
Globally, the graph depicts a steady increase in water use from 1900 to 2000, with a noticeable spike in the latter half of the 20th century. This surge can be attributed to industrialization and population growth, underlining the escalating demand for water resources on a global scale.
Comparing water consumption in two countries, Country A and Country B, as outlined in the table, reveals striking disparities. In 1980, Country A’s per capita water consumption was significantly higher than that of Country B. However, by 2000, the tables turned, with Country B surpassing Country A in per capita water usage. This shift may be indicative of changing socio-economic factors, technological advancements, or shifts in water management strategies in the two nations.
Furthermore, the table also highlights the total water use in both countries. While Country A exhibited a consistent upward trend in total water use from 1980 to 2000, Country B experienced a fluctuating pattern, with a notable decrease in total water consumption in 1990. This divergence suggests diverse trajectories in water resource management and utilization strategies between the two countries.
In conclusion, the graph and table shed light on global water usage trends and variations in water consumption between Country A and Country B. The data underscores the complex interplay of factors influencing water utilization patterns, including industrialization, population growth, and evolving socio-economic dynamics.