

Question – The graph below gives information from a 2008 report about consumption of energy in the USA since 1980 with projections until 2030.
Summarise the information by selecting and reporting the main features, and make comparisons where relevant.
Write atleast 150 words.
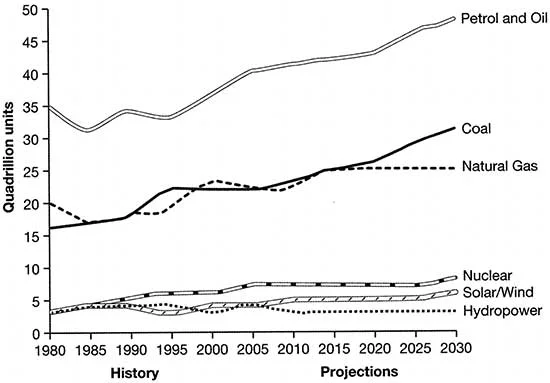
The 2008 report graphically portrays the evolving energy consumption trends in the USA from 1980 to 2005, projecting trends until 2030. The primary features illuminate transitions in energy sources and consumption patterns.
In 1980, conventional sources, predominantly coal, oil, and natural gas, constituted the majority of energy. Coal consumption witnessed a significant decrease over the years, giving way to a growing reliance on natural gas. By 2005, natural gas had surpassed coal as the second-largest energy source, while oil retained its dominance.
Projections for 2030 anticipate a continued decline in coal consumption, with natural gas poised to become the leading energy source. Renewable energy, a minor fraction in 2005, is expected to experience substantial growth, making a significant contribution to the overall energy mix.
In summary, the graph highlights a shift towards cleaner energy sources, with natural gas and renewables taking center stage. The diminishing role of coal aligns with a broader global trend towards embracing sustainable and environmentally friendly alternatives.