

Question – The graph below shows average carbon dioxide (CO2) emissions per person in the United Kingdom, Sweden, Italy and Portugal between 1967 and 2007.
Summarise the information by selecting and reporting the main features, and make comparisons where relevant. Write atleast 150 words.
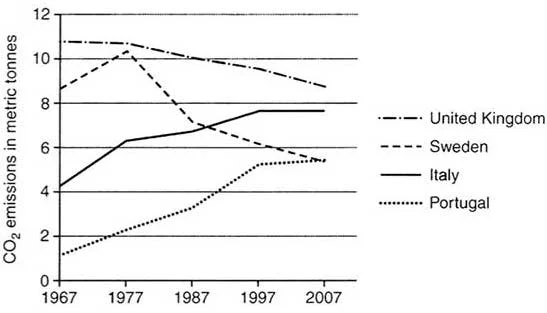
The graph illustrates the average carbon dioxide (CO2) emissions per person in the United Kingdom, Sweden, Italy, and Portugal from 1967 to 2007. Notable trends emerge when examining the data.
In 1967, the United Kingdom and Sweden had similar CO2 emissions per person, both hovering around 10 metric tons. Over the years, the UK experienced a gradual increase, peaking at approximately 11.5 metric tons in the mid-1970s, while Sweden’s emissions remained relatively stable. Italy and Portugal started with lower emissions in 1967, around 5 and 3 metric tons respectively. Italy’s emissions increased steadily, surpassing 8 metric tons by 2007, while Portugal’s rise was less pronounced, reaching around 6 metric tons.
By 2007, Sweden maintained the lowest average emissions at approximately 6 metric tons per person. The United Kingdom experienced a decline from its peak, settling at around 9 metric tons. Italy’s emissions continued to rise, while Portugal exhibited a modest increase.
In summary, the graph reveals diverse trajectories in carbon emissions among these nations over the four decades, reflecting variations in industrialization and environmental policies.