The Ielts Bridge

The graph below shows the unemployment rates in the US

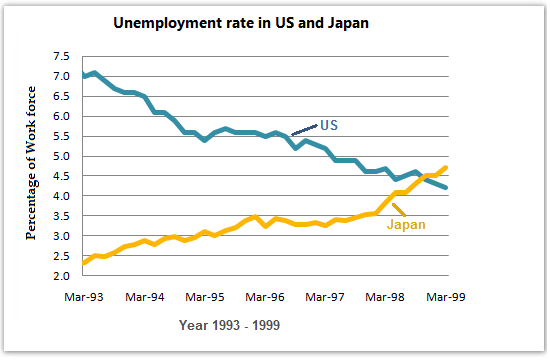
Question – The graph below shows the unemployment rates in the US and Japan between March 1993 and March 1999.
Write a report for a university lecturer describing the information shown below. You should write at least 150 words.
Unemployment in the US and Japan - 1993 & 1999

THE IELTS BRIDGE

BEST IELTS INSTITUTE IN DEHRADUN

Let's Start a Conversation

Call us at:

+91-7302390901

Email us at:

[email protected]

Address:

46 D Pathribagh, Doon Sarla Academy,
SGRR PG College Rd, Dehradun,
Uttarakhand - 248001

Scroll to Top