

Question – The three pie charts below show the changes in annual spending by a particular UK school in 1981, 1991 and 2001.
Summarise the information by selecting and reporting the main features, and make comparisons where relevant. Write at least 150 words.
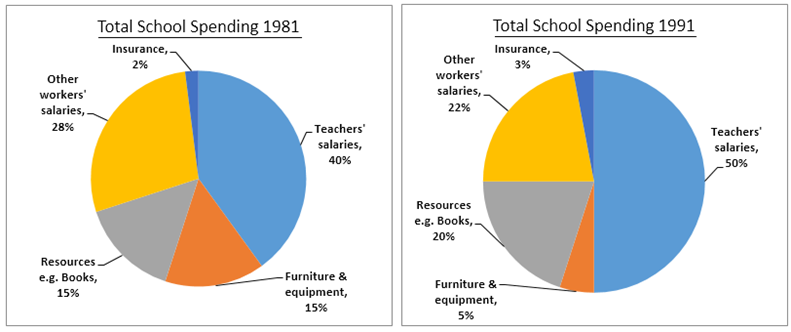
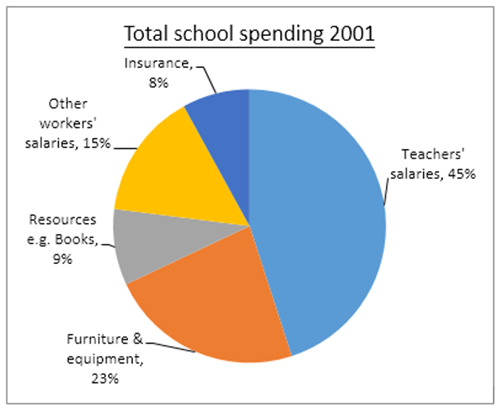
The three distinct years of 1981, 1991, and 2001 are represented by pie charts that show the overall information regarding the change in annual spending at a particular UK school. All things considered, when it came to expenditures in the years under consideration, the portion of educators’ paychecks was the highest. In contrast, insurance contributed the least in terms of actual financial outlay.
First off, in 1981, the salary of educators was precisely forty percent. It rose to half of the total expenditure ten years later. Nonetheless, expenditure in the same category decreased slightly to 45% in 2001.
Furthermore, after the salaries of educators, the salaries of other employees also revealed a significant budgetary proportion. Between 28% in 1981, 22% in 1991, and only 15% in 2001, this area saw a slight decline in the observed years.
Nonetheless, one field saw a steady improvement in yearly spending. The one that kept going up was insurance. In 1981, 1991, and 2001, the corresponding percentages were 2%, 3%, and 8%. Between 1991 and 2001, there was a notable 5% increase in improvement. Insurance, however, continued to be the least expensive sector in terms of spending.